The New Soffront Enterprise Dashboard provides better reporting interface with superior user experience.
The dashboard gives a graphical representation of the various processes and flows of a company’s business model. This allows you to view and analyze the performance of your business in the form of composite graphs, charts and business reports and helps you take educated business decision.
How to Use Soffront Enterprise Dashboard
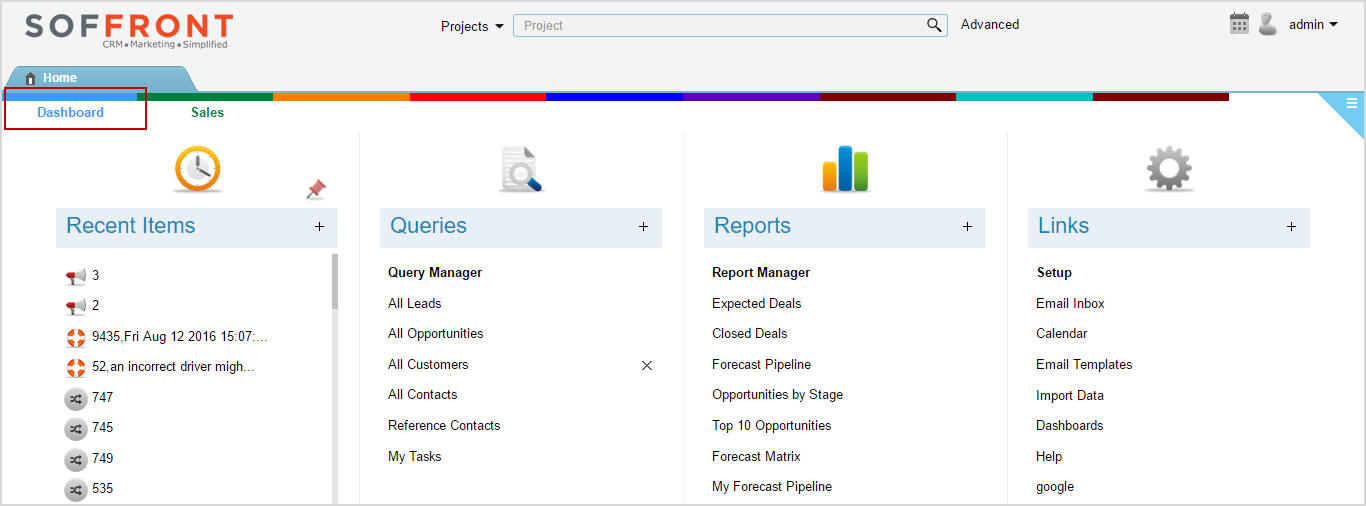
- Click on Dashboard button on left hand corner of your screen to open Dashboard
2. All user catagories are added on the left hand column under Dashboard and Categories. These are the same catagories you can see on your homepage colorbar.
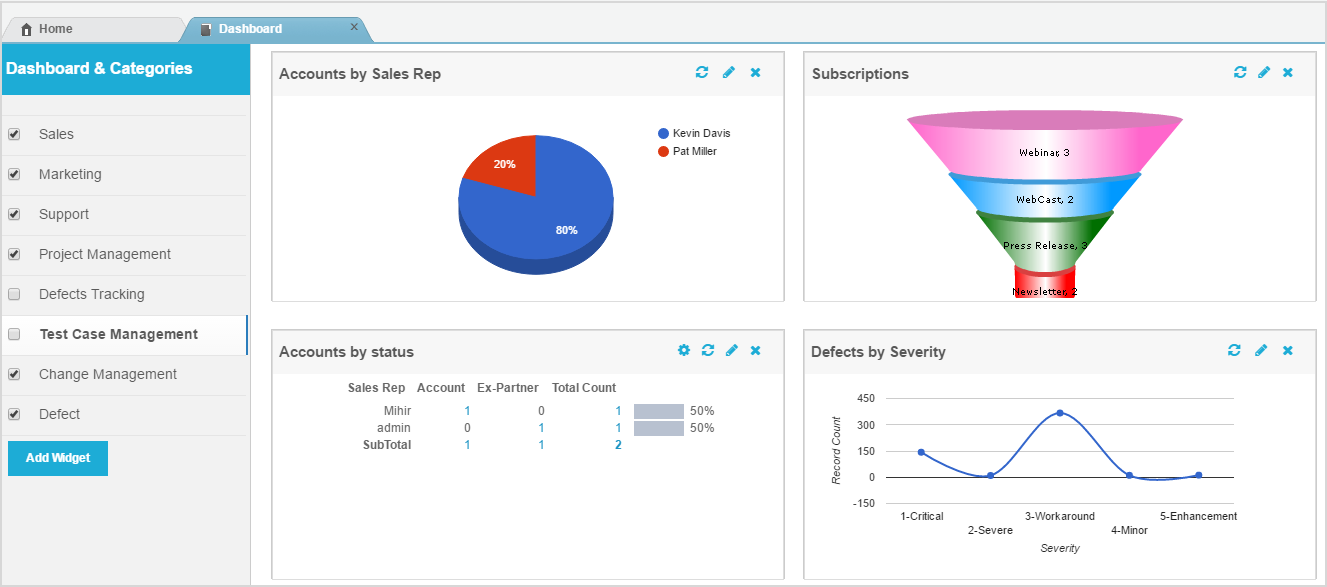
3. Select a category to built and display related reports in the form of variety of charts and graphs on the dashboard.
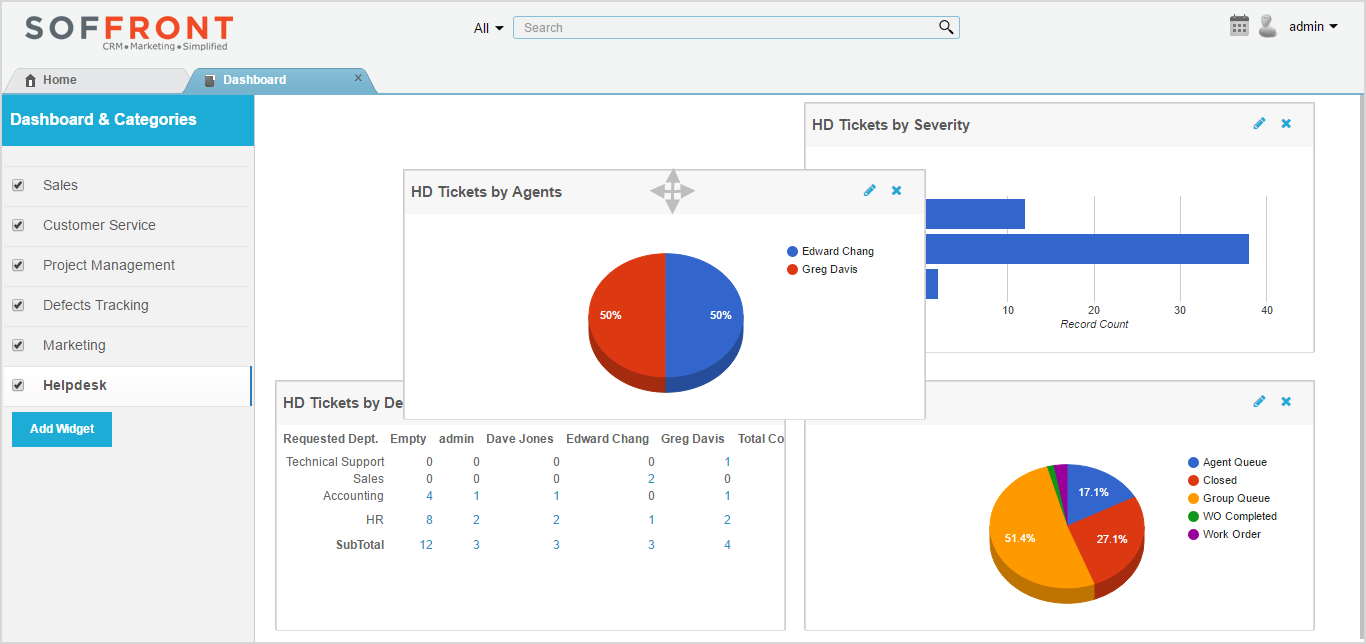
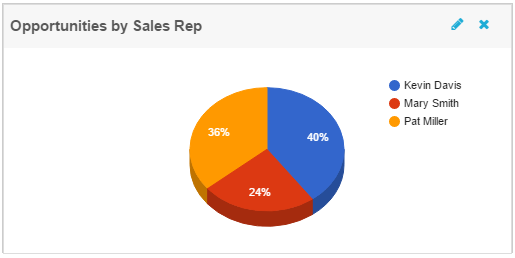
4. Mouse Over graphs and charts to see details.
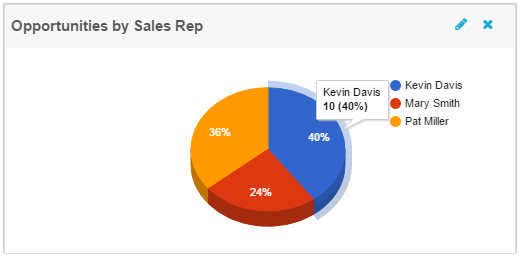
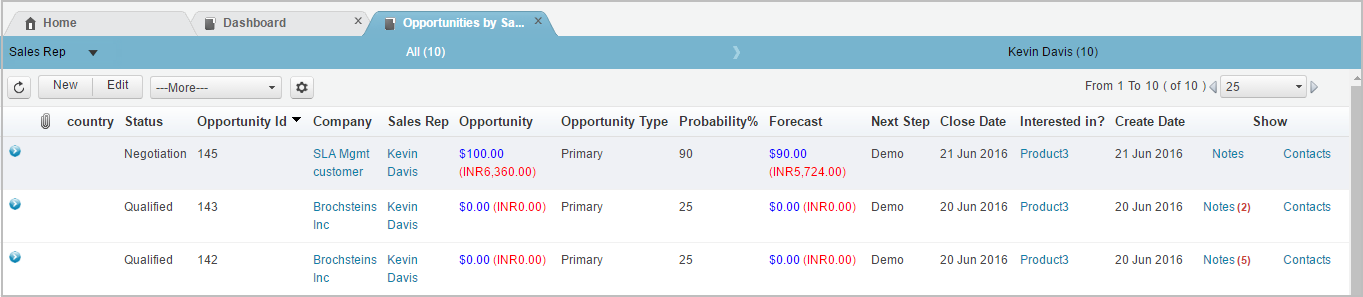
5. Click on any of the bar of a bar graph or a slice of a pie in a pie chart to see deeper analysis.
6. Reorganize your dashboard gadgets by by dragging and dropping them.
Add Reports to Dashboard
Note: Users with permission will only be able to create new reports, all other users will only be able to view and use the dashboard.
- Select a category from the left hand column.
- Click on Add Widget to add a new report.
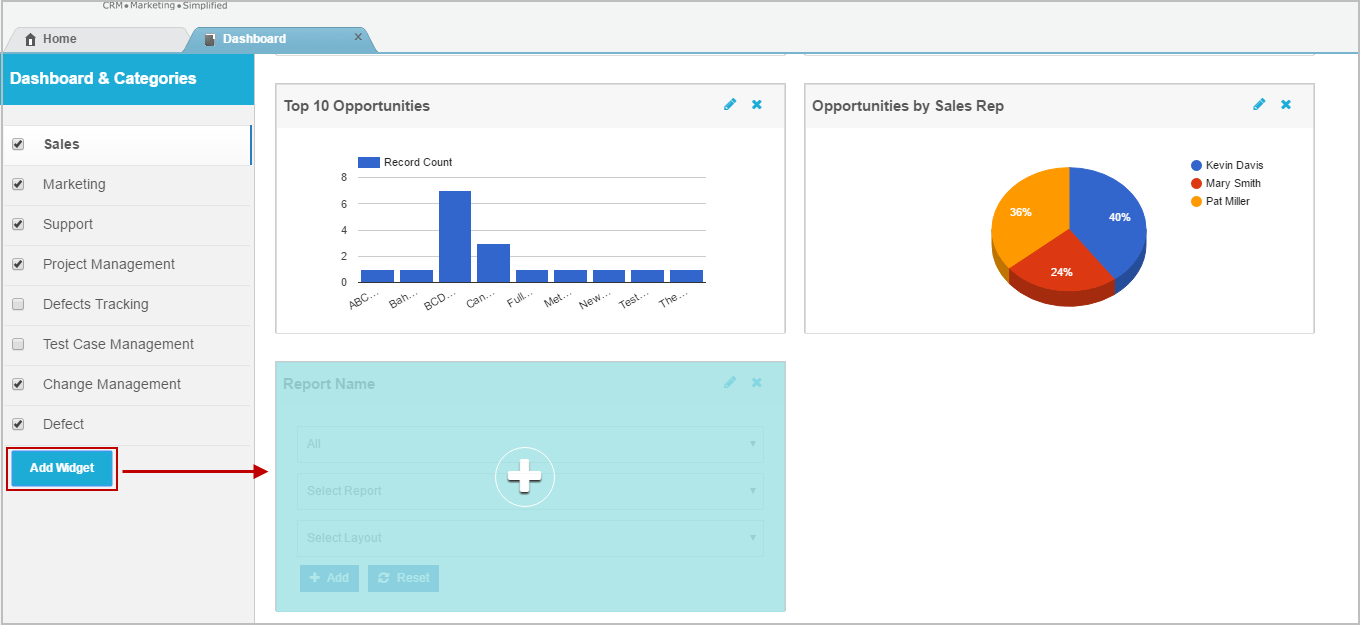
3. Click on + button to create Dashboard report.
- All: Select Table from the drop -down list.
- Select Report: All reports related to the object will be listed, select one from the dropdown list.
- Select layout: Select how you want to display the report. You can select from Pie Chart, Bar Chart, Column Chart. Line Chart and Funnel Chart.
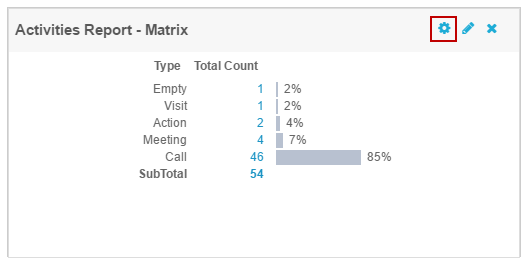
Note: For Matrix Reports the layout is predefined, skip select layout and click on Add to see report.
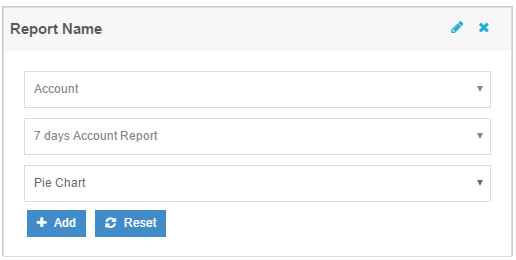
- Click on +Add to add the Report to Dashboard or click on Reset to start over again.
4. Click on the pencil icon to make changes to the report.
5. Click on X to remove the report from Dashboard.
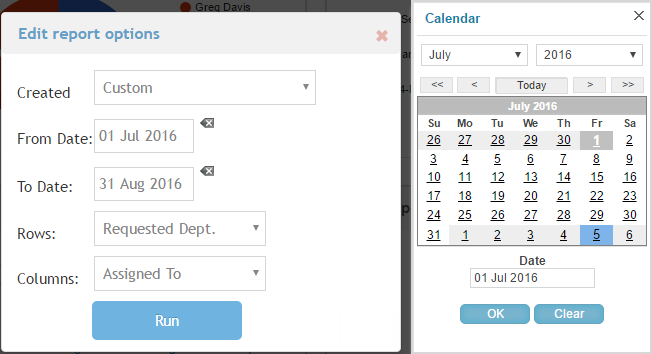
6. For Metrix reports click on the  gear wheel icon to change parameters such as dates, rows and columns.
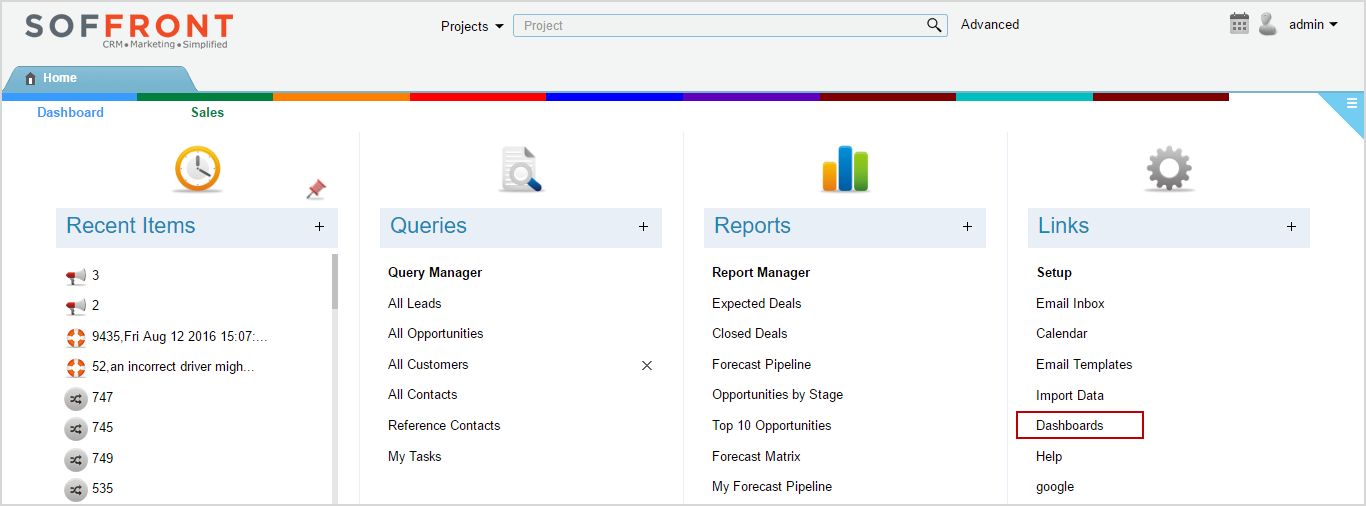
Note: The dashboard link on the homescreen will allow you to access the old Dashboard that you currently have. This will help you to manually migrate the Dashboards to the new infrastructure at your own pace.